Uncertainty of Forecasts and Estimation of Uncertainty
In the case of economic forecasts, we often talk about, for example, annual GDP growth of 1.4 per cent for the current year or a 6.7 per cent unemployment rate for the next year. Such forecasts are called point estimates. In reality, however, economic forecasting to this degree of accuracy is impossible, and it is very unlikely that the GDP growth rate for next year, for instance, would exactly match the forecast figure. There are many reasons why it is impossible to make precise forecasts. First of all, in the economy, almost everything affects almost everything, and the forecaster can never know everything. Secondly, the economic phenomena may even be completely unpredictable. In addition to this, data revisions, for example, affect the accuracy of forecasting, as it is very difficult to get a precise idea of the next year’s economic situation if there is still no certainty about the situation of the previous year.
Even though one can never have a perfect picture of the economy, and economic forecasting is never precise, economic forecasts will nevertheless be published. Forecasts correspond to the best estimate of the future based on what is known when the forecast is made. The more we know, the more accurate the forecasts are. Forecasts for the current year’s economic growth are on average always more accurate than forecasts for next year’s economic growth.
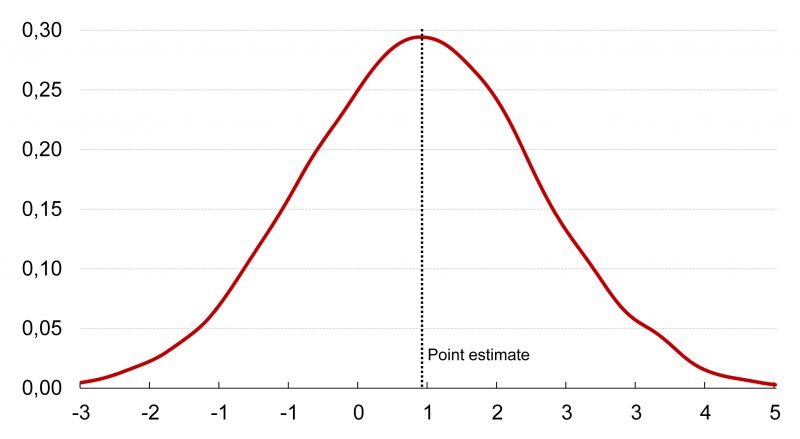
The uncertainty of the forecasts can nevertheless be measured and an estimate of the uncertainty associated with the forecast can be provided in addition to the point estimate at the time the forecast is made. However, accurate estimation of uncertainty is often challenging, and even if the forecaster has a precise estimate of the uncertainty of the forecast, it is much more difficult to communicate that type of estimate to the public than a point estimate. The point estimate is very easy to present and understand. On the other hand, a single number can create an illusion of the certainty of the forecast. In reality, the predictions correspond to some sort of probability distribution called the predictive distribution, and the point estimate is the value at which that forecast distribution peaks.
It is often impractical, however, to communicate the predictions as predictive distributions or densities. In addition to point estimates, some additional key figures can nevertheless be provided to illustrate the uncertainty associated with the forecasts. For example, the upper and lower bounds of the credible interval can be used to estimate how likely it is that the value to be forecast will end up in the credible interval. This is often not possible, however, because in addition to challenges in communicating the predictive distribution, the estimation of the predictive distribution itself is more difficult than it is to produce a mere point estimate.
Econometric models can be used to produce predictive distributions that can shed light on the uncertainty of the forecast. In other words, the uncertainty of the forecast is measurable when the forecast is based on an econometric model. However, in addition to models, macroeconomic forecasts are almost exclusively based on subjective considerations of professional forecaster. It is very difficult to estimate the uncertainty of predictions based on subjective considerations, since it is virtually impossible to define a purely discretionary predictive distribution. Discretion and subjective considerations, however, allow for utilizing information that might not be possible to include in an econometric model.
The most suitable econometric models for forecasting are those that are able to use theoretical information and experts’ knowledge as efficiently as possible. One compromise between a discretionary and purely model-based forecasting approach is to use an econometric model which enables the professional forecaster to adjust or restrict the model according to his or her expertise. Such an approach makes it possible to produce predictive distributions and accurately measure the uncertainty associated with the forecast.
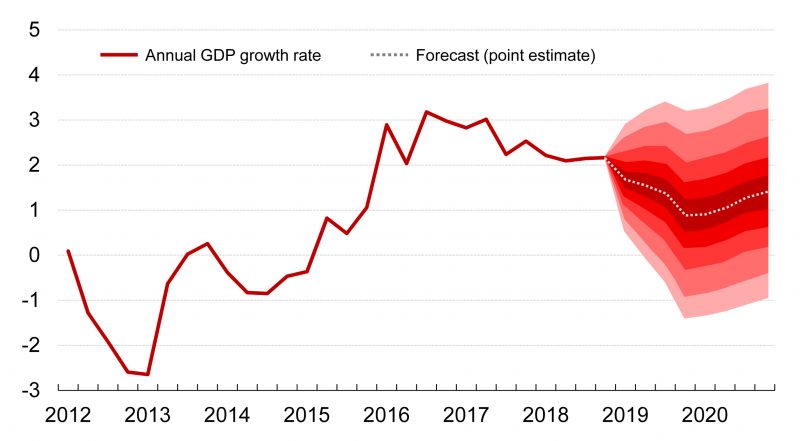
Figure 2 shows a forecast produced using an econometric model as described above depicting Etla’s official forecast for the annual growth rate of Finland’s Gross Domestic Product from the first quarter of 2019 to the end of 2020. According to Etla’s forecast, Finnish GDP will grow by 1.4 per cent this year and by 1.2 per cent next year. The grey dotted line represents the point estimate of the forecast, i.e. the most likely forecast at the time the forecast is made, and the different shades of red around the point estimate depict the uncertainty of the forecast. The figure shows that the uncertainty of the forecast is very high, and not much can be said with any degree of certainty about the rate of economic growth one year in the future. In the figure, the darkest area contains 20 per cent of the probability mass of the predictive distribution and the entire coloured area contains 90 per cent of the probability mass of the predictive distribution.
 Figure 1: Simulated predictive distribution of the annual growth of the Finnish GDP in 2019Q4.
 Figure 2: Forecast of the annual growth of the Finnish GDP in 2019 and 2020, %.
The estimate of the uncertainty of the adjacent forecast has been produced by simulating thousands of alternative futures using an econometric model (BVARX model)[1] and using these scenarios to estimate the shape of the probability distribution for each quarter over the next two years. The forecast distributions produced in this fashion can be used to answer much more subtle questions than mere point estimates. For example, Figures 1 and 2 show that GDP will grow in the fourth quarter of 2019 with a probability of about 75 per cent (annual growth), as around 75 per cent of the probability mass of the predictive distribution shows growth higher than zero.
These kinds of probability estimates should nevertheless be treated with the same caution as point estimates, as all estimates are subject to uncertainty. This also applies to estimates of uncertainty itself. All predictions of the future, whether based on econometric models or expertise, are based on our very limited perception of the past, and there is no reason to assume that we could, on the basis of the past, make precise estimates even about the uncertainty of the future. Moreover, econometric models cannot provide reliable estimates of the likelihood of highly unlikely or rarely occurring events, and the predictive distributions generated by the models should not be used to answer questions about such events.[2] A full predictive distribution nevertheless describes the true nature of a forecast much better than a mere point estimate, and forecasts should be communicated whenever possible as full predictive distributions or densities. Unfortunately, however, this is not usually possible due to the difficulties in communication and estimation of the predictive distributions.
A similar predictive distribution can also be generated for other items in the national balance of supply and demand. Also, for the distributions to reflect all the uncertainties associated with the forecast, they should also capture the uncertainty associated with the statistical data revisions. On the other hand, the uncertainty associated with the tails of the distribution cannot be taken into account precisely in any calculations regarding the uncertainty of a forecast.
[1] For more details, see the article by Jetro Anttonen to be published later in 2019 in the Etla Working Papers series.
[2] For example, the outbreak of the financial crisis in 2008.